TL;DR
A conversion funnel is the sequence of pages and handoffs a paid click passes through before it converts. Six funnels cover most paid traffic: ecommerce cold, ecommerce high-intent, lead gen, SaaS trial, booking, and high-ticket, and the landing page does a different job in each. Step rates multiply, so cost per acquisition is CPC divided by the product of every step’s rate from the click on. Fix the step with the most room first.
Useful conversion funnel examples show every page a paid click passes through, each step’s one job, and the number that tells you it’s broken.
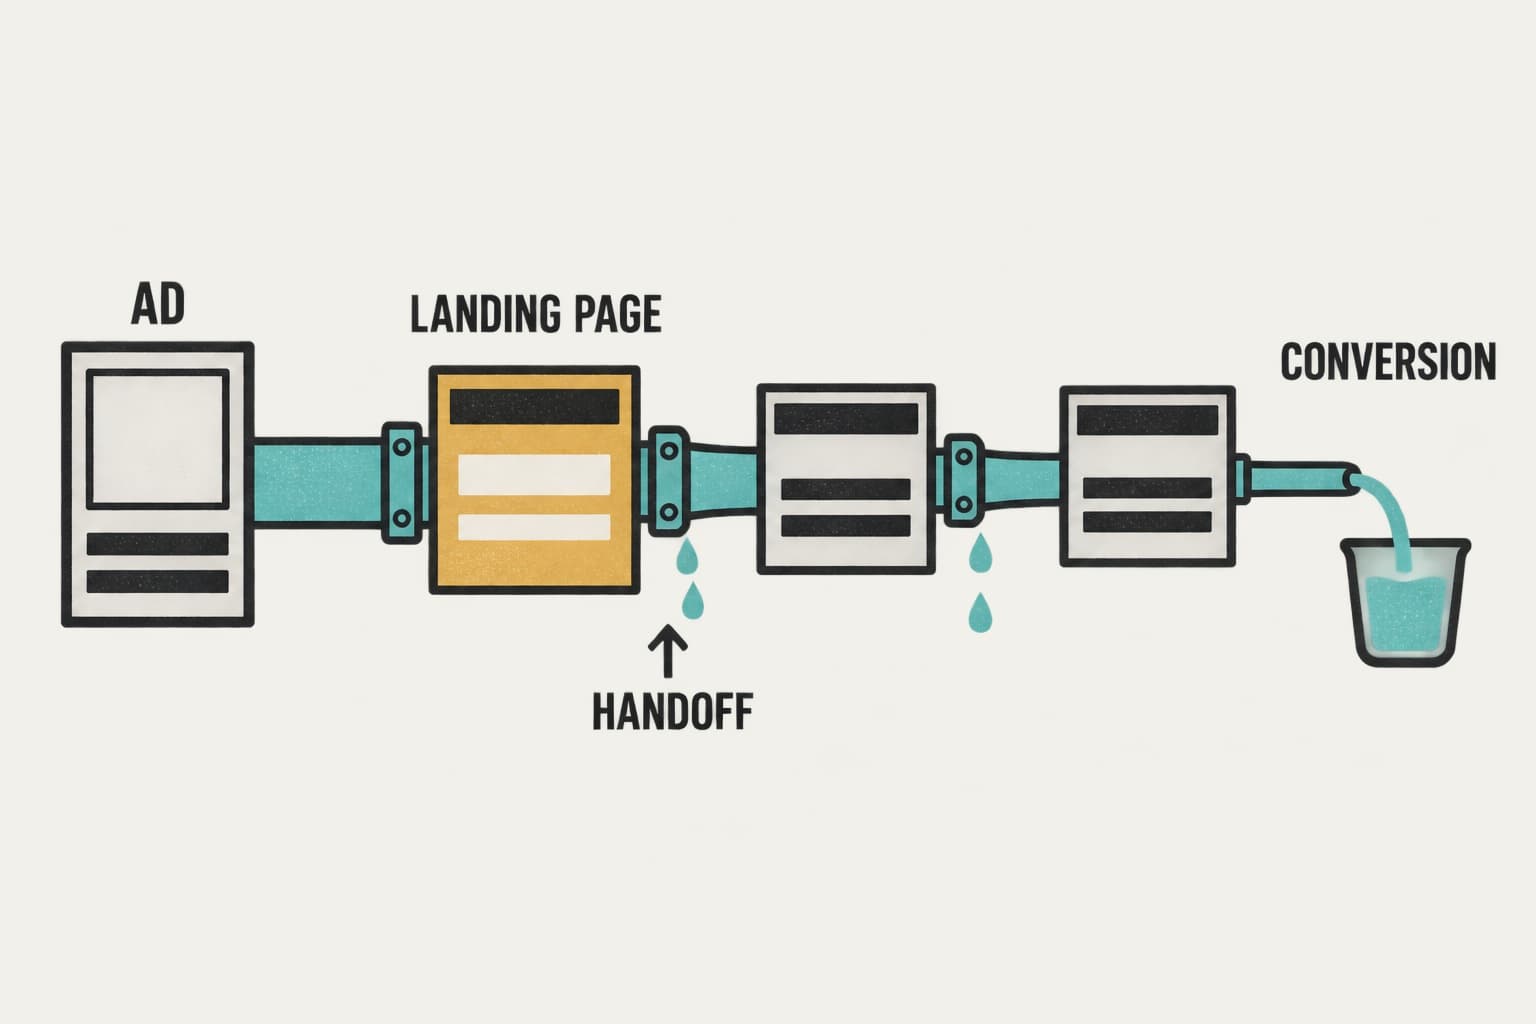
Most funnel diagrams are an upside-down triangle with four words in it. They rarely tell you which page to build or which step is losing money. Your funnel is a set of pages, and every handoff leaks.
Below: six funnels across five business models, the math that ties them together, and how to measure across handoffs.
Key Takeaways
- The landing page’s job changes by model: it sells the offer in ecommerce, it is the conversion in lead gen, and it hands off to another tool in SaaS and booking.
- Step rates multiply. At an illustrative $1.20 per link click and steps of 40%, 12%, 60%, and 50%, cost per purchase is $83.33. Lifting one step from 12% to 15% cuts it to $66.67.
- Judge each funnel on the conversion that pays (purchase, qualified lead, show-up, paying customer), not the first form fill.
- Handoffs break measurement. Put the same tags on every step you didn’t build, and carry UTMs into forms, booking tools, and signup apps.
What is a conversion funnel?
A conversion funnel is the sequence of steps a visitor takes from first contact to a defined conversion: a purchase, signup, or booked call. For paid traffic, each step is a page or handoff (ad, landing page, form or cart, checkout or calendar), and each one loses visitors.
Conversion funnel vs marketing funnel vs sales funnel
The terms overlap. A marketing funnel covers the whole path from awareness to purchase, paid or not. Sales funnel stages lean toward the steps a sales team runs: lead, qualified lead, call, close. A conversion funnel is the measurable part between a visit and a conversion.
Why the funnel isn’t outdated
Google’s “messy middle” research found shoppers loop between exploring and evaluating options as many times as they need before buying (Think with Google). The path to purchase isn’t a straight line.
The path from a paid click to a conversion is different: a sequence you own and can instrument, from ad to page to cart or form to checkout or calendar.
Build a page for every step you pay for. Point Pagedeck at an ad and it builds the page that continues its pitch. See how ad-matched landing pages work.
Conversion funnel stages: TOFU, MOFU, BOFU
Most marketing funnel stages boil down to the TOFU MOFU BOFU shorthand: awareness, consideration, and conversion. For paid traffic, stages are entry points: temperature decides where a click lands, and the section order for each traffic temperature follows from that.
| Stage | Traffic | Typical paid source | What the page has to do |
|---|---|---|---|
| TOFU | Cold | Social and video prospecting | Earn belief before the pitch |
| MOFU | Warm | Retargeted visitors and engagers, email list | Answer the objection that stopped them |
| BOFU | Hot | Branded and high-intent search, cart and form abandoners | Get out of the way: offer, terms, one CTA |
Where paid traffic enters the funnel
Cold traffic needs a step before the offer: a pre-sell page, a quiz, or a content offer. Hot traffic can skip it. The expensive mistake is sending one temperature to a page built for another.
Take a hypothetical payroll software company whose marketer, call him Leo, sent cold Meta traffic straight to “Book a demo.” At a $6 CPC, 0.8% of clicks booked: $750 per demo request.
He moved cold traffic to a compliance checklist page converting 15% of clicks ($40 per lead), with a demo offer on the thank-you page. Eight percent of leads booked: $500 per demo request. (Illustrative numbers, and only a win if those demos close at the old rate.)
Where the landing page sits in every funnel
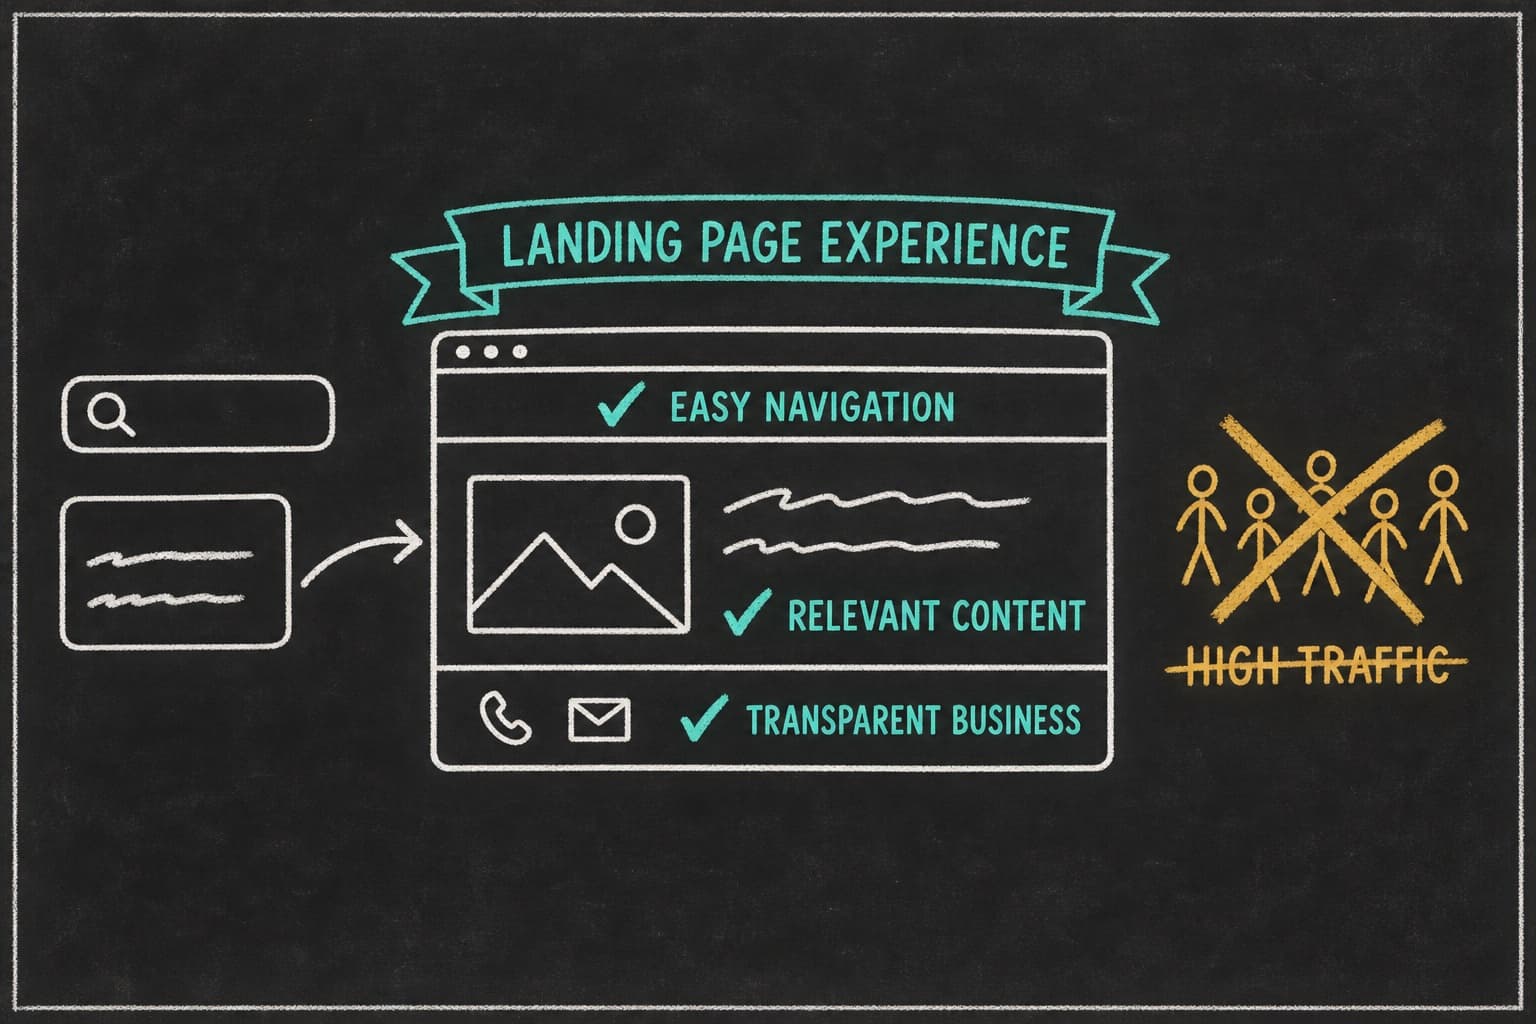
The landing page’s job changes by model, and the conversion it produces is rarely the one that pays.
| Funnel | Landing page’s job | Converts on the page | Conversion that pays | Handoff that breaks |
|---|---|---|---|---|
| Ecommerce | Sell the offer (after a pre-sell, if cold) | Add to cart | Purchase | Cart to checkout |
| Lead gen | The page is the conversion | Form submit | Qualified lead, then sale | Form to CRM |
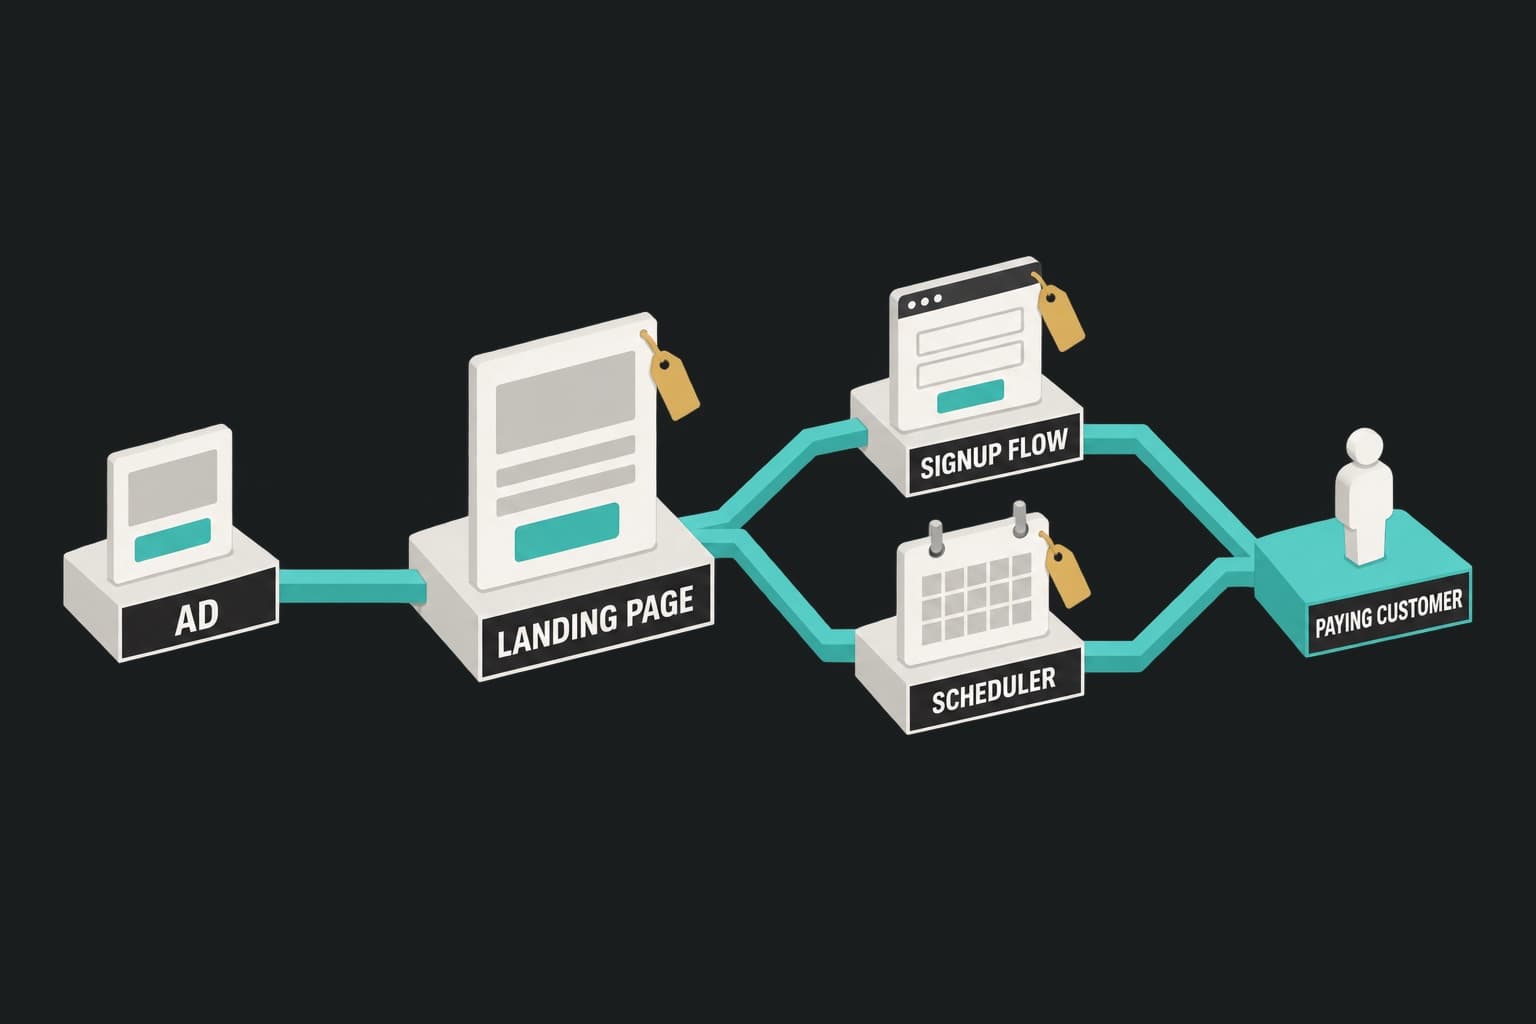
| SaaS trial | Set up the first session | Signup start | Activation, then paid | Page to signup app |
| Booking | Get the booking, set up the visit | Booking | Show-up, then sale | Page to scheduler |
| High-ticket | Qualify and build belief | Application | Closed deal | Application to call |
One page for the whole business fails. Each funnel, and each ad inside it, needs a matching landing page for every ad you run, judged on the conversion that pays.
6 conversion funnel examples for paid traffic
These examples of marketing funnels share one breakdown: path, traffic, steps and metrics, math, leak, and first test. The numbers are illustrative, not benchmarks.
1. Ecommerce funnel, cold social traffic
Path: Meta or TikTok ad > pre-sell page > offer page > cart > checkout > post-purchase offer
Traffic: cold prospecting.
- Pre-sell (listicle landing pages or advertorials as a pre-sell step): build belief before the pitch. Metric: click-through to the offer page.
- Offer page: present the product and the offer. Metric: add-to-cart rate.
- Cart and checkout: raise AOV, then take the payment. Metrics: cart-to-checkout and checkout completion rates.
- Post-purchase offer: add to the order. Metric: take rate.
Illustrative math: $1.20 per link click, 40% click through the pre-sell, 12% add to cart, 60% of carts reach checkout, and 50% complete it. Click to purchase is 0.4 × 0.12 × 0.6 × 0.5 = 1.44%, so cost per purchase is $83.33. (Each link click counts as a pre-sell visit here; some never load the page.)
Where it leaks: at the offer page, when it drops the pre-sell’s promise, and at the cart, when shipping first appears. Baymard Institute puts average documented cart abandonment at 70.22% across 50 studies, and extra costs top the reasons shoppers give once “just browsing” is set aside.
Test first: the offer, such as BOGO and bundle offers or tiered discounts, with shipping terms on the offer page. This is the ad-matched funnel Pagedeck builds for Shopify stores: pre-sell, offer page, and custom cart. Checkout stays Shopify’s, with UTMs preserved and purchases attributed to the page and variant.
2. Ecommerce funnel, high-intent traffic
Path: search or retargeting ad > landing page or product page > cart > checkout
Traffic: warm or hot.
- Landing page or product page: remove the last doubt. Metric: add-to-cart rate.
- Cart and checkout: keep the total honest and the steps short. Metrics: cart-to-checkout and completion rates.
Illustrative math: $2.50 per click, 20% add to cart, 50% reach checkout, and 50% complete. Click to purchase is 0.2 × 0.5 × 0.5 = 5%, so cost per purchase is $50. The click costs about twice as much and the purchase 40% less: fewer steps, each converting better on warmer traffic.
Where it leaks: retargeting visitors back to the page they already left, unchanged.
Test first: the answer to whatever stopped them: a guarantee, a free-shipping threshold, or reviews. For where to send this traffic, see landing page vs product page for paid traffic.
3. Lead generation funnel
Path: ad > capture page with an embedded form > thank-you page > nurture > sales conversation
Traffic: any temperature. B2B marketing funnels and local services both run this shape.
- Capture page: trade something the visitor wants for contact details. Metric: capture rate (submits per click).
- Thank-you page: set up the next step. Metric: next-step click rate.
- Nurture and sales: qualify and close. Metrics: qualification rate and close rate.
Illustrative math: an $8 CPC and a 10% capture rate is $80 per lead. If 40% qualify, that’s $200 per qualified lead. If a quarter of those close, media cost per customer is $800.
Where it leaks: at the form-to-CRM handoff. If the form doesn’t record each lead’s source, you can’t tell which ad produced qualified leads.
Test first: the incentive, then the headline, with form fields last. The form comes from your own CRM or email tool, embedded on the page, and Pagedeck can count its submit as the conversion. Here’s how to build a lead gen landing page.
4. SaaS marketing funnel: free trial
Path: ad > landing page > signup > activation > paid plan
Traffic: cold or warm social and non-brand search.
- Landing page: make a specific first-session promise. Metric: signup rate.
- Signup and activation: reach the first real result in the product. Metric: activation rate.
- Paid plan: convert when the trial ends. Metric: trial-to-paid rate.
Illustrative math: a $5 CPC and a 4% signup rate is $125 per trial. If 40% activate, that’s $312.50 per activated trial. If half of those pay, media cost per paying customer is $625.
Where it leaks: between the page and the first session. The ad promised a finished report in five minutes, and the product opens on a setup wizard.
Test first: the trial terms and the first-session promise. Signup runs in your app, so put the same tags there, and read activation and trial-to-paid in your product and billing data. For the page itself, see SaaS landing pages.
5. Services and booking funnel
Path: search ad > landing page > booking embed > reminders > show-up > sale
Traffic: hot. Someone searching “emergency dentist near me” wants the service now.
- Landing page: confirm you serve them, soon, at a fair price. Metric: booking rate.
- Reminders and show-up: get them to the appointment. Metric: show rate.
- Sale: Metric: close rate.
Illustrative math: a $4 CPC and an 8% booking rate is $50 per booking. A 50% show rate makes it $100 per kept appointment, and a 40% close rate makes it $250 per sale.
A hypothetical clinic marketer, call her Priya, might run those numbers. Her page said “Free consultation” and nothing about price, and half her bookings never showed. She added a price range and what the first visit involves.
Booking rate fell to 5% ($80 per booking). Show rate rose to 80% and close rate to 50%, so cost per sale dropped to $200. The same share of clicks walked in, and more of them bought. (Illustrative numbers.)
Where it leaks: at the show rate, and at the scheduler, which lives on another domain and drops your tags unless you add them.
Test first: expectation-setting on the page, judged on cost per sale, not cost per booking.
6. High-ticket sales funnel
Path: ad > long-form page (case study or video) > application > qualification call > close
Traffic: cold to warm, for offers priced in the thousands.
- Long-form page: build belief and let the wrong people opt out. Metric: application start rate.
- Application: qualify before anyone gets on a call. Metric: qualified rate.
- Call and close: Metrics: show rate and close rate.
Illustrative math: a $2.50 CPC and a 2% application rate is $125 per application. With 50% qualified, 80% showing, and 25% closing, media cost per sale is $1,250 on, say, a $6,000 offer.
Where it leaks: an application so easy that unqualified people fill the calendar, or so long that buyers quit.
Test first: proof matched to the buyer, such as a case study from their industry, and the qualifying questions.
Other funnel shapes worth knowing
Quiz funnels
A quiz sits between the ad and the offer. The answers personalize the recommendation and qualify the visitor, which suits skincare, insurance, and software plans.
Webinar funnels
Registration page > reminders > session > offer. It’s a booking funnel with a group appointment, judged on sales per registrant.
App install funnels
Ad > app landing page or store listing > install > in-app event. Everything after the store lives in the app stores and your mobile measurement partner.
Funnel math: where the money leaks
Click-to-conversion rate is the product of every step’s rate, and cost per acquisition is CPC divided by that product. Here’s example 1 on 10,000 link clicks at $1.20 ($12,000 spend), then with the offer page lifted to 15%:
| Step | Step rate | Visitors left | Offer page at 15% |
|---|---|---|---|
| Link clicks | 10,000 | 10,000 | |
| Pre-sell to offer page | 40% | 4,000 | 4,000 |
| Add to cart | 12% (then 15%) | 480 | 600 |
| Cart to checkout | 60% | 288 | 360 |
| Checkout completion | 50% | 144 | 180 |
| Cost per purchase | $83.33 | $66.67 |
A three-point lift on one step (25% relative) cut cost per purchase 20%.
Fix the weakest step, not the loudest one
Because the rates multiply, a 25% relative lift on any step lifts the whole funnel 25%. Moving add-to-cart from 12% to 15% is worth exactly as much as moving cart-to-checkout from 60% to 75%.
The loudest leak above is the cart, where 70% of carts never become purchases. But that’s in line with Baymard’s documented average, and checkout runs on Shopify, where you control less. On the offer page you control the offer, the proof, and the terms. Start there.
One funnel per audience, not one funnel per business
Two audiences, two funnels. Gravel’s customers split between women buying travel blankets and men buying toiletry bags and duffels, and all its paid traffic went to the homepage.
Gravel tested campaign-specific landing pages against the homepage with about 10% of its budget and reported 66% lower cost per conversion on one side of the business and 37% lower cost per purchase on the other. Here’s how Gravel cut cost per conversion by 66%. Those are Gravel’s ecommerce results, not a forecast for any other funnel.
Ready to build a page per audience? Point Pagedeck at each ad and it builds the page that continues that ad’s pitch. Build your first page free, no credit card needed.
Measuring a funnel across handoffs
Funnels break at handoffs, where the visitor moves to a tool on another domain.
UTMs across checkout, forms, and booking tools
- Checkout: UTMs have to survive the jump, or purchases lose their paid source.
- Forms: capture UTMs in hidden fields so each lead’s source reaches your CRM.
- Booking tools and signup apps: install the same tags there and pass the UTMs into the record.
On Pagedeck pages, UTMs from the ad pass through automatically, and tags you add in Pagedeck fire on every Pagedeck page. Steps Pagedeck didn’t build (booking tool, form host, signup app) need the same tags.
Attributing the conversion to the page and variant that earned it
Pagedeck counts any event you define as a conversion through its tracking pixel: a lead, a booking, a signup. On Shopify, purchases are attributed to the exact page and A/B variant. Qualification, show rate, and trial-to-paid live in your CRM, scheduler, or billing data, so connect them by UTM.
Take a hypothetical account run by a media buyer named Dana, selling an invoicing app on Meta. Her product counted 520 signups in a month, but only 310 carried a paid social source. The signup app never stored the UTMs, and her pixel wasn’t installed there.
She added the same tags to the signup flow and saved UTMs on each new account. Split by ad, one angle’s signups activated at 48% and the other’s at 22%, so she moved budget to the first. (Illustrative numbers.)
Testing one step at a time
Test one step at a time, judged on the conversion that pays. Every Pagedeck page ships with server-side A/B testing, so tests don’t flicker on paid traffic. Fulton, an insole brand, ran 50+ iterations on dedicated pages and reported a 110% increase in paid conversion rate. For sample size, see A/B testing landing pages.
Where to find real conversion funnel examples
The best marketing funnel examples are ones you walk yourself: click a competitor’s ad, then follow every step.
- Ad libraries: Meta’s Ad Library shows active ads. Click through to the pages behind the longest-running ones.
- Competitor funnels: screenshot every step, including the thank-you page.
- Pagedeck’s research agent: 1M+ live landing pages from any company running Meta ads (ecommerce, B2B, SaaS, services, and lead gen), searchable by niche, offer, brand, or tactic. Watchlist alerts tell you the moment a competitor launches a new funnel.
You’ll see pages, not conversion rates. Treat each one as a hypothesis.
Frequently asked questions
What are the 5 stages of the marketing funnel? The common five-stage model is awareness, consideration, conversion, loyalty, and advocacy. For paid traffic, the first three decide which pages you build.
What is a good conversion rate for a funnel? Unbounce’s 2024 Conversion Benchmark Report found a 6.6% median landing page conversion rate across 41,000+ pages, with industry medians from 3.8% to 12.3%. That’s one step; judge the full funnel on cost per final conversion against what it’s worth.
What are the types of marketing funnels? The six above: ecommerce cold, ecommerce high-intent, lead generation, SaaS trial, booking, and high-ticket, plus quiz, webinar, and app install variations.
What is the most effective marketing funnel? The best sales funnel examples share one trait: they’re the shortest path the traffic’s temperature allows. Every step multiplies in a loss, so hot traffic skips the pre-sell and cold traffic needs one.
How do I create a funnel for my business? Start from the conversion that pays and what it’s worth. Pick the entry step by traffic temperature, give each page one job and one metric, tag every step, and test the one with the most room.
Conclusion
A conversion funnel is the pages and handoffs between a paid click and the conversion you pay for. Judge each one on the conversion that pays, fix the step with the most room, and measure across every handoff.
Pagedeck builds the pages you control: pre-sell and ad-matched landing pages for any business, plus offers and a custom cart on Shopify, with server-side A/B testing on every page.
Build your first page free, no credit card needed, and give every ad in your conversion funnel a page that matches it.